Do We Actually Need to Replace the Western Hills Viaduct?
TL;DR - In this post, I look at who would be impacted if we simply removed the viaduct. Spoiler: less than 5% of the population would be drastically impacted...
Introduction and Background
If you live in the Cincinnati area, by now you should have heard that the Western Hills Viaduct is in a fairly dire situation at the moment and calls for a replacement have reached an almost fevered pitch. While all this squealing for a replacement has been going on, I couldn’t help but wonder if a replacement was actually what Cincinnati needs? As it currently stands, it requires $1 million per year just to maintain and a replacement is expected to cost $335 million.1 This is an absurd amount of our money to be spending on another road project. This got me thinking, does the current viaduct generate at least $1 million a year in revenue for the city to justify its ongoing maintenance? Would a replacement viaduct generate $335 million in revenue for the city to justify its cost? Who would be impacted if we simply got rid of the viaduct and invested the money elsewhere? While I can’t answer all these questions, I can focus on the last one. But first, a little refresher.
During the early 1900’s as private car ownership began to take off across the country, commuting patterns underwent drastic changes.2 In Cincinnati, as this relates to the Western Hills Viaduct, once tight-knit and walkable neighborhoods such as Price Hill became choked with traffic, and began expanding outwards. These newly minted suburbanites needed a way to quickly enter and exit the city via their private cars and so between 1930-32 the Western Hills Viaduct was built. Later in that same decade, the FHA was created and coupled with redlining the suburban development explosion ensued.2 Fueled by the irrational fears of living amongst minorities and powered by an endless stream of financial government handouts available exclusively to white families (white flight), areas such as Delhi, Covedale, Cheviot, Dent, and Mack rapidly came into existance.2,3,4 Because of the completely car dependent nature of these areas, traffic quickly grew and upgrades were soon needed. These upgrades came during 1960-63 when the eastern end of the Western Hills Viaduct was rebuilt to accommodate connections to I-75.
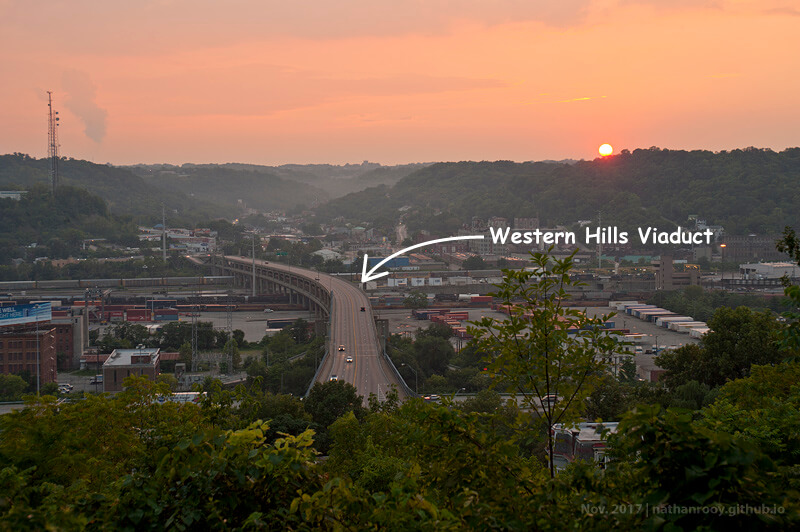
Today, the Western Hills Viaduct is one of several arterial roads that connect the west side with I-75 and the rest of Cincinnati. Seen below, the Western Hills Viaduct and its many alternatives are highlighted.

As the Western Hills Viaduct continues to slowly crumble away, it forces us to realistically evaluate is purpose in a city that’s quickly moving into the future.
Methodology
This post is primarily interested in looking at how much of the Hamilton County/Cincinnati population would be impacted by the removal of the Western Hills Viaduct and where these people reside. To accomplish this, I have created several maps representing the potential delay incurred by all Hamilton County residents in the absence of the viaduct. As a simple example: imagine that you’re driving from Price Hill to Clifton and it takes you 15 minutes. Now, hypothetically without the Western Hills Viaduct, your journey time increased to 17 minutes. This represents a delay of 2 minutes or roughly 13.3%. Your starting location in Price Hill will now be marked as having a 13.3% delay when traveling to Clifton. Using this simple format, I calculated the percent delay for every address in Hamilton County to several common shopping and employment centers. For a complete explanation on the numerical computations employed during this post, skip down to the Technical Notes section below.
Results
Now for the good stuff! I decided on five destinations: the Cincinnati Zoo, downtown, the University of Cincinnati, Western Hills Plaza, and Xavier University. Keep in mind, if you’re trying to determine whether or not you could be impacted, consider these destinations as rough approximations. If you’re driving from Price Hill to Corryville, while I didn’t include Corryville as an exact destination, it’s within half a mile of the University of Cincinnati which I did include. Because of this, the University of Cincinnati map could be used as a very loose approximation for this particular situation.

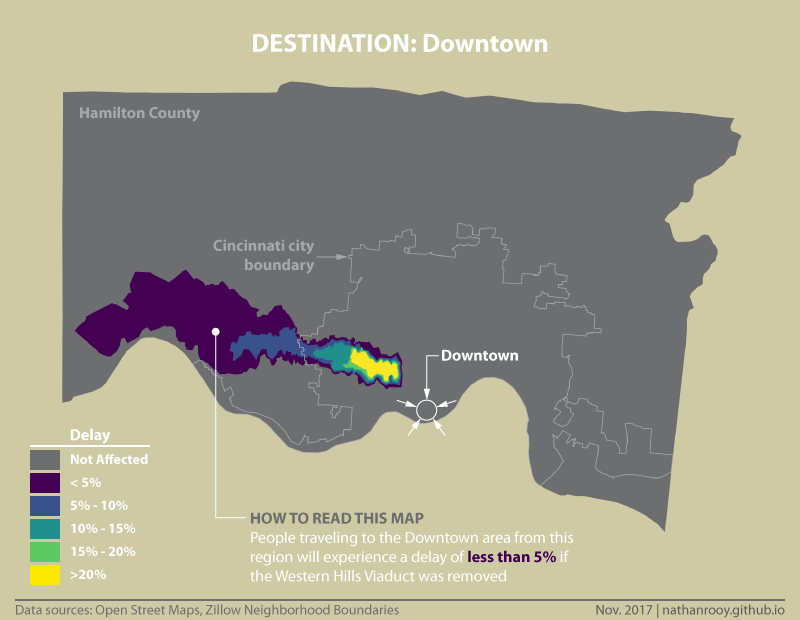
One thing to keep in mind when looking at these maps is to consider trip duration. For example, if you’re traveling from the western edge of the viaduct to downtown, that journey is only about seven minutes. While this location has been marked as incurring a delay of “20% or more”, 20% of a seven minute drive is less than a minute and thirty seconds.


One thing to note is that the removal of the viaduct does not affect traffic entering or exiting highway I-75. Because there have been so many alternatives to the Western Hills Viaduct built over time, highway traffic remains largely unaffected.

Now that the delay maps have been generated, the next logical step is to look at how much of the population is impacted. As an example, in the downtown destination map, the purple shaded area representing a “5% or less” delay looks large (it covers 5.74% of the total Hamilton County land area) but because this area covers almost exclusively low density commuter sprawl, it represents only 3.87% of the Hamilton County population or roughly 31,077 people. This might seem like a large number of people but contrast that to the 742,995 people who are completely unaffected by the removal of the viaduct within that same map.

It’s interesting to note that in every destination example, over 95% of Hamilton County residents remain basically unaffected by the potential removal of the Western Hills Viaduct. Additionally, no one outside of Hamilton County is impacted.
Final Thoughts
Personal costs — During 2017, between fuel, insurance, depreciation, maintence/repairs, car payments, parking, tolls, etc., the monthly cost to own and operate a private vehicle is just over $700 per month. This translates to nearly $8500 per year.5 That’s a trip for two to Bora Bora for several weeks. But instead, residents are forced to spend that (or nearly that) on a car that remains parked and motionless for the vast majority of its life. What if we invested $335 million making Cincinnati less car dependent instead? What if the 5% of residents who are adversely affected by the viaduct get to save $8500 per year because public transportation was improved in those areas? By providing transportation alternatives we improve the city for everyone. Fewer cars on the road means less traffic, less pollution, and less auto accidents, and financial savings for everyone.
Maintenance costs vs. economic value — In addition to a $335 million price tag, it has been noted that the viaduct would require $1 million per year in maintenance expences.1 This seems unrealistically low given that it’s widely acknowledged that infrastructure projects such as roads, bridges, and highways require 3 percent of their total cost in maintenance every year.6 This means that if Cincinnati wants to maintain the new viaduct, it must spend somewhere between $1 million dollars and $10 million dollars per year! Will the replacement viaduct contribute at least $1 million dollars in yearly economic value for the city? Does it even have a chance of contributing $10 million dollars to the local economy?
Induced demand & disappearing traffic — In his book Street Smart, Samuel Schwartz (the former NYC Traffic Commissioner) details the time when the West Side Highway in New York City collapsed and the counterintuitive phenomenon of disappearing traffic occurred. I bring this up because the West Side Highway carried almost twice the number of vehicles per day as the Western Hills Viaduct here in Cincinnati but instead of wasting more money to replace it, they simply didn’t. I’ll let Samuel Schwartz tell the rest:
Nearly everyone, including most engineers, assumes that a constricted traffic artery behaves like a garden hose: reduce the diameter from one inch to one-half inch, and the pressure increases. But drivers are aren't water molecules. When a road's capacity is reduced, congestion doesn't necessarily increase, In fact, the biggest and best study of the reduction in road capacity shows that lane closures not only cause traffic to decrease on the roads remaining lanes, but only half the decrease reappears anywhere else. This means that if two lanes are closed on a four-lane boulevard, it might carry only 60 percent of the cars it did before the closure; but if you look at every alternative route, you'll be able to account for only half of the "missing" drivers. In an urban setting with alternative routes or public transit options — that is, one with at least some commitment to smart street design — 20 percent of the boulevard's traffic will just disappear. "If you unbuild it, they will go away" - (Street Smart, pg. 47)
One very cheap, and easy way to test this here in Cincinnati is to simply close the viaduct for a few weeks. A simple traffic A/B test that costs basically nothing to conduct could potentially save us $335 million…
Spending fairness — One of the biggest reasons to look for alternatives is simply a matter of spending equality. Unlike the Metro, streetcar, and bike lanes, which are funded by everyone and open to everyone, the viaduct is only open to those who own a car. Additionally, the car owners potentially using the viaduct on a regular basis are a tiny minority of the total population. What this means is that the many who live downtown and surrounding walkable neighborhoods who are smart enough to live life without the burden of a car end up footing the bill for this replacement. This is hardly a fair situation. Suburban commuters have already ruined cities once before, shouldn’t we begin to mend the damages they caused? At the very least let’s not repeat the same mistakes twice. Lastly, for the people who use it everyday, stepping out of their routine might be uncomfortable but should the rest of the us be required to suffer because of this? There are many ways in which we can spend our money that benefit everyone, not just a select few.
Long term subsidies — The areas most reliant on the Western Hills Viaduct are also some of the most subsidized areas of Hamilton County. Areas like Delhi, Covedale, Cheviot, Dent, and Mack would not exist if it weren’t for the FHA subsidizing white families to move there in the first place.3,2 Per person, these low density areas require more roads, telephone lines, sewers, water pipes, gas pipes, more fire stations, more police stations, more of everything.7 These areas also have some of the lowest taxes, which means we’re all paying for these residents to live within this inefficient development pattern. These neighborhoods were built using subsidies, and their continued existence depends upon them.8,9 This is the most anti-free market situation imaginable, and financially unsustainable over the long-term. It’s time we start planning for the future. Should everyone in Cincinnati and Hamilton County have to waste $335 million subsidizing a few butthurt suburban commuters so they can shave a couple seconds off their commute? It’s not our fault they mistakenly decided to segregate themselves from the rest of society on the geographical fringes of civilization. It’s certainly shouldn’t mean that we have to pick up the tab for it.
Happy city and financial sustainability — It’s been unequivocally proven that people who waste their lives commuting in private cars are fatter, unhappier, and less social than their counterparts downtown and surrounding neighborhoods who walk and bike.9,10,11 Knowing this, do we really want to spend more money that will only further reinforce these negative aspects? These subsidised sprawling neighborhoods are an anomaly amongst civilization’s long history of neighborhoods and cities built at a walkable, human scale.12 Walkable neighborhoods are the economic engines of our society. Therefore, we should be doing everything we can to increase the quality of life within these areas. We should be spending our money in ways that foster a better community by bringing us together, not by making it easier to separate ourselves. We should be reducing the lanes on Liberty street. We should be connecting our neighborhoods with bike lanes. We should be spending our money in ways that reduces the amount of pollution we create, not increases it. Cincinnati could be a city that doesn’t require car ownership to have a functional life. A city that saves its residents money rather than sinks it into endless money pits.
Suggestions?
Did I miss anything? Should I add another destination? Did I not consider a certain perspective in my summary? Please let me know. Everyone who reads this post will in some way have contributed in the form of tax dollars to a potential replacement or alternative.
Technical Notes
All calculations were performed using Python scripts I wrote while using OpenStreetMap13 data via Geoff Boeing’s OSMnx.14 Network routing was carried out with NetworkX.15 The location of every residential dwelling in Hamilton County was scraped from the Hamilton County Auditor’s webpage which was completed during a previous project back in February. Additionally, I generated points on every road in Hamilton County to account for any potential delays incurred for people traveling from highways, parks, etc. Travel times were calculated based off the speed limit as recorded by OpenStreetMaps and the length of the road segment. Because not all network edges (roads) in the OpenStreetMaps database include a speed limit, a default of 25 mph was imposed. These instances of missing speed limits were very rare and predominantly occurred on smaller, less traveled residential back roads which made the default 25 mph a safe estimate. Contours were generated in QGIS using the contour plugin from Chris Cook and Lionel Roubeyrie. Calculations involving population were based on the U.S. Census blocks shapefiles from 2010. I used an area weighted scheme when calculating populations. As an example: if a particular census block had 100 people in it, and 45% of it was covered by the “5% or less” delay region, then 45 people from that census block were counted towards the total number of people who will incur a “5% or less” delay. In the event that a fraction of people were impacted, that population value was always rounded to the nearest integer. And lastly, I used this project as an excuse to finally force myself to learn Adobe Illustrator so all maps and charts passed through AI at some point.
Sharon Coolidge, Finally, a plan to pay for the Western Hills Viaduct (www.cincinnati.com - Published 8:34 a.m. ET August 25, 2017) ↩︎ ↩︎
Kenneth T. Jackson, Crabgrass Frontier: The Suburbanization of the United States (Oxford University Press, 1987) ↩︎ ↩︎ ↩︎ ↩︎
Richard Rothstein, The Color of Law: A Forgotten History of How Our Government Segregated America (Liveright, 2017) ↩︎ ↩︎
David M. P. Freund, Colored Property: State Policy and White Racial Politics in Suburban America (University of Chicago Press - May 15, 2010) ↩︎
AAA, AAA Reveals True Cost of Vehicle Ownership (http://newsroom.aaa.com - August 23, 2017) ↩︎
Samuel I. Schwartz , Street Smart: The Rise of Cities and the Fall of Cars (PublicAffairs - September 8, 2015) ↩︎
Pamela Blais, Perverse Cities: Hidden Subsidies, Wonky Policy, and Urban Sprawl (UBC Press, 2011) ↩︎
Vishaan Chakrabarti, A Country of Cities: A Manifesto for an Urban America (Metropolis Books - May 30th, 2013) ↩︎
Charles Montgomery, Happy City: Transforming Our Lives Through Urban Design (Farrar, Straus and Giroux, 2013) ↩︎ ↩︎
Howard Frumkin, Lawrence Frank, and Richard J. Jackson, Urban Sprawl and Public Health: Designing, Planning, and Building for Healthy Communities (Island Press, 2004) ↩︎
Robert D. Putnam, Bowling Alone: The Collapse and Revival of American Community (Simon & Schister, 2001) ↩︎
Jeff Speck, Walkable City: How Downtown Can Save America, One Step at a Time (North Point Press - November 12, 2013) ↩︎
Map data copyrighted OpenStreetMap contributors and available from https://www.openstreetmap.org ↩︎
Boeing, G. 2017. “OSMnx: New Methods for Acquiring, Constructing, Analyzing, and Visualizing Complex Street Networks.” Computers, Environment and Urban Systems. 65, 126-139. doi:10.1016/j.compenvurbsys.2017.05.004 ↩︎
Aric A. Hagberg, Daniel A. Schult and Pieter J. Swart, “Exploring network structure, dynamics, and function using NetworkX”, in Proceedings of the 7th Python in Science Conference (SciPy2008), Gäel Varoquaux, Travis Vaught, and Jarrod Millman (Eds), (Pasadena, CA USA), pp. 11–15, Aug 2008 ↩︎