A Low Cost Approach to Improving Pedestrian Safety with Deep Learning
TL;DR - Using TensorFlow and a Raspberry Pi, I developed a cheap and accurate way of counting both pedestrians and vehicle traffic.
POST UPDATE: Since posting this, I've received a considerable amount of interest from individuals and local city governments from across the U.S. looking to get a better grasp on pedestrian data. Because of this, I spent some time building out a better algorithm and packaging it for easy use. I'm terrible with names, so for now it's simply "urban mobility tracker". If you can think of a better name, please let me know! Additionally, to generate detections for the urban-mobility-tracker, I performed a full model retraining of MobileNetV1 SSD using data I collected and annotated. I'm calling this new pedestrian/vehicle/bicyclist optimized object detector "PedNet". As time goes on and more people use these two tools, I'm hoping that people will contribute more training data (especially in adverse lighting and weather conditions) so that PedNet can be retrained and improved. Lastly, this new version continues to use TensorFlow but with the addition of the Coral USB accelerator which leverages Google's TPU technology so now it achieves an update frequency of ~10Hz!!! (old version was ~2Hz)
GitHub links:
• Urban-Mobility-Tracker [here]
• PedNet [here]
Introduction
As someone who bikes to work everyday, I’m acutely aware of how important good urban design and planning is and its impact on pedestrian safety as well as the overall well-being of a neighborhood. I’m also aware of how difficult it is to convince car dependent, suburban commuters that we need to invest our money into bike lanes and curb extensions rather than lane extensions and parking lots. Because of this, I’m always a bit bummed when I see unfounded internet shouting matches over why the city should/should not implement bike and pedestrian safety measures. We should let the data decide what happens, not ideology or personal bias. Unfortunately, it’s this data that’s hard to come by.
I remember when shortly after the bike lanes on Central Pkwy were installed, they were looking for volunteers to stand out in the baking sun all day and manually count cyclists as they rode by. This struck me as comically old-fashioned but also a bit sad because this was apparently the only way to get the data at the time. Fast forward almost five years and the situation appears to not have improved much. Below is a picture I took recently of some pneumatic tubes used to count traffic.

These are great for temporarily counting cars and other large vehicles. Counting bikes, and pedestrians, not so much… When I rode over them that morning on my bike, I was indistinguishable from a motorcycle. I’m an invisible cyclist, so why should the city prioritize this road for a bike lane? Additionally, this setup was in place for less than a day because those tubes are held in place using nails pounded into the road surface and reinforced with a couple strips of Kentucky chrome. Definitely not ideal.
| System | Type | Cost |
|---|---|---|
| SenSource | pneumatic | $695 |
| RoadPod | pneumatic | $1,150 |
| JAMAR TRAX I Plus | pneumatic | $2,600 |
| Wavetronix SmartSensor HD | radar | $6,700 |
| Miovision Technologies VCU | video | $3,700 |
Although other counting systems exist, they tend to be overly expensive, invasive, and unable to simultaneously count both pedestrians and vehicle traffic.1 Cincinnati is full of bikers, I see them every day. But if they’re not being counted, we’ll never be able to overcome the suburban bias in Cincinnati’s urban design and planning. With a better counting system in place we can get the necessary data to make informed decisions that reflect reality, resulting in a fairer and more equitable city. If only there was a low-cost, non-invasive solution that could passively count all types of traffic simultaneously in any weather condition 24/7/365 and seamlessly push that information to the cloud on a minute by minute basis…
My Solution
After thinking about this for a while, I decided that I could probably do a better job than what currently exists. Given that low-cost and high accuracy are my two primary goals, I went with a Raspberry Pi Zero which is the smallest/cheapest of the Raspberry Pi models with the 8-megapixel v2 NoIR (infrared) camera and a rechargeable usb battery pack. Since my system is vision based it needs a clear line of sight to the street but also somehow remain hidden from people who might tamper with it. Given these two contradictory constraints of being hidden yet visible, I went with a stealth approach. This was accomplished by buying a plastic weatherproof electrical box and cutting a hole on the front for the camera. The camera hole was sealed with a clear lens filter. Lastly, I mounted six stupidly strong neodymium magnets on the back so I could attach it to street lights, sign posts, etc.
To actually count pedestrians and vehicle traffic I built out a convolutional neural network (CNN) with a secondary region proposal network (R-CNN) using TensorFlow and Python. This allows for both the detection and localization of objects within the frame. Actual object tracking was accomplished using a light weight temporal clustering scheme using NumPy and scikit-learn. For a more in-depth look, click [here] to read the technical notes section.

After a week or so of casual coding I had a finished system. Given that the tracking algorithm is built on top of open-source software, the only costs associated with this system arise from the hardware side.
| Item | Cost |
|---|---|
| Raspberry Pi Zero | $10 |
| Plastic electrical box | $14 |
| Magnets | $18 |
| 128GB usb storage | $28 |
| USB Battery pack | $40 |
| Total | $110 |
As an example of what all this looks like in action, below is a gif showing the tracking algorithm when it was placed at random spots throughout Cincinnati.
Results
To test my system out, I placed it at few areas throughout the city. I started out by leaving it out in the field for 24 hours at a time. After I got comfortable with its performance I extended that duration to a full week (usually Sunday night to Sunday night).
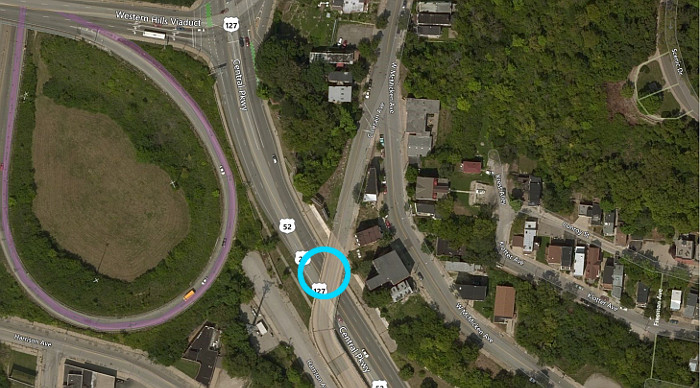
As an example of the data that this system produces, below are the results for when it was placed on the Colerain Ave. bridge right as it passes over Central Pkwy during August 23, 2018.
Because the system generates a time stamp for each object as it passes over an imaginary “start/finish”, I binned all these data points into five-minute blocks. Additionally, even though vehicle traffic can be further broken down by vehicle type, it was easier to just group all vehicles into a single class. Above in figure 6, we can see the influx of southbound commuters coming into the city during the morning rush as well as when they leave in the evening rush headed north. Vehicle traffic peaked at 88 northbound vehicles per five minutes around 5:20pm. The day ended up with a total of 6982 southbound and 7092 northbound vehicles travelling on this particular segment of Central Pkwy.
Because the frequency of bicycle and pedestrian traffic was so much smaller relative to vehicle traffic, it was easier to display this data from a cumulative perspective. Above in figure 7, the bicycle count on Central Pkwy can be seen. Even with the cumulative form, we can see a large amount of growth during the southbound morning rush into the city, but compared to vehicle traffic, the evening bicycle rush is more diffused. Total bicycle traffic for the day capped out at 56 and 57 for the northbound and southbound directions respectively.
Lastly, the pedestrian traffic can be seen above in figure 8. Unlike both vehicle and bicycle traffic, pedestrian traffic on Central Pkwy doesn’t have large spikes during the morning / evening rushes. Instead, pedestrian traffic is diffused fairly evenly throughout the entire day.
Learnings and Future Improvements
Over the span of this project I was able to fully test the limits of this first prototype and came away with a few key points.
Algorithm Improvements — Although the current two-part solution works, it is far from elegant and definitely not the most efficient solution. I am actively building out several new deep learning based solutions that combine the detection, localization, and tracking into a single operation within TensorFlow Lite using a MobileNets2 style framework. My hope is that these new versions will improve performance during heavy occlusion or low light while reducing computational overhead. In theory, if this were ever implemented with permission from a city (and thus solar-powered), I could potentially use something more energy intensive such as an NVIDIA Jetson or similar IoT board. The combination of the increased horsepower, and reduced computational load would hopefully allow for a frame rate closer to 10Hz rather than the current 2Hz.
Energy Storage and Connectivity — Because I was flying under the radar during this project, I was limited in two areas; energy consumption and connectivity. Ideally I would have paired the 30,000mAh battery pack with a solar panel mounted on top. The solar panel would then power the Raspberry Pi and charge the battery pack during the day, while the battery pack alone would power it during the night and through overcast days.
The issue of connectivity would become the next obstacle in long-term deployment. As it currently stands, I use a 128GB usb memory card to store all the trajectory data. I could have paid for a Raspberry Pi cellular data plan, but I completely expected my prototype to get stolen. Given the ideal situation of being able to connect to an ethernet line, indefinite deployment becomes an actual possibility.
Camera Placement — After a little trial and error, I discovered that the best position is ideally high over the center of the street with at least 100 yards of visibility. The hundred yards requirement was function of the slow frame rate of 2Hz. Presumably if I had faster hardware, I could increase the frame rate and reduce the required field of view. The elevation requirement is important because it reduces the occlusion, especially when there are multiple lanes of traffic. Lastly, I always tried to position the camera in a loosely northward facing direction and in close proximity to a street light. This allowed me to count traffic at night but also reduce the chances of incurring any glare or direct sun light which could wash out the images during the day.
Thermal Management — The current version relies on passive cooling because weather sealing had the highest priority. Because of this limitation, I conservatively placed it in areas that were always shaded. This prevented me from measuring several road segments I was interested in but also forced me to get creative for others. If this were ever implemented with permission from a city, I would definitely build in a solar-powered fan for reducing mid-day heat buildup.
Conclusion
Overall I was really happy with the final results and I learned a lot about deploying a self-contained system into the wild. It would be nice to let this system harvest data for an extended period of time so that long-term trends could be accurately measured. With a system like this, a measurable impact of bike infrastructure investment could be generated. It could also provide the underlying data needed to justify new infrastructure proposals.

Cincinnati government/department of transportation get at me. I want to help!
Technical Notes
Within this section, I’ll cover the technical details in-depth. There are only a couple key components to my system, mainly the algorithm, training data, and hardware.
Data — Using labelImg3, I manually annotated examples of each class. This was fairly time-consuming, but it gave me good chuck of time to catchup on podcasts so it really wasn’t too bad. I could have been substituted this manual data annotation with existing datasets such as the Caltech Pedestrian Detection Benchmark or one of the Daimler Pedestrian Benchmark Data Sets but one of my primary goals with this project was to start at zero and finish with a solid working solution. I was also concerned with the discrepancy of training on full color data but operating with the infrared data coming from the v2 NoIR image sensor. Lastly, I was also curious as to whether my dataset could help overcome some known shortcomings in regards to Faster R-CNN.4,5 Below are the results from my manual annotation. Note that images are captured and analyzed at 1280x720 resolution.
| Label | Annotations (#) |
|---|---|
| Pedestrians | 59 |
| Bicycles | 259 |
| Cars | 593 |
| SUVs | 217 |
| Pickup Trucks | 137 |
| Trucks | 229 |
| All annotations | 1494 |
Machine Learning — There are two primary parts to the tracking algorithm. The first is the deep learning based object detection and localization. For this I utilized a TensorFlow based implementation of Faster R-CNN6, which is the new and improved version of Fast R-CNN7, which is the new and improved version of R-CNN8. This particular implementation of Faster R-CNN was built on top of Res-Net1019 which had been trained on the COCO10 data set. I could have went with a faster single shot detection (SSD) framework such as YOLO/YOLOv311, but I was more concerned with positional accuracy12 because at the time my secondary goal was to measure vehicle/pedestrian speed. Training was carried out using the GeForce GTX 1050 GPU on my laptop which ended up taking roughly three hours.
The second component is the tracking aspect of the algorithm. Once the objects in the current time frame have been detected and localized, they are clustered using k-means over a time window of three frames. At an image capture rate of 2Hz, this translates to one second. This worked decently well for this initial prototype, but definitely has its limitations. I touch on several ways in which this can be improved [here]. Below I made a general flow chart depicting the tracking process.

Hardware — This initial version uses the v2 Pi NoIR 8-megapixel/1080p30 (Sony IMX219 sensor) camera paired with the Raspberry Pi Zero. The lack of computing power resulted in the tracking algorithm unable to exceed a frame rate of 2Hz. All of this was powered by a 30,000mAh USB battery pack. In hindsight, I should have probably just gotten the Raspberry Pi 3 B+ with some kind of small industrial battery pack.
Accuracy Comparison of Non‐Intrusive, Automated Traffic Volume Counting Equipment. (October 2009) ↩︎
A. G. Howard, M. Zhu, B. Chen, D. Kalenichenko, W. Wang, T. Weyand, M. Andreetto, H. Adam, MobileNets: Efficient Convolutional Neural Networks for Mobile Vision Applications. (Submitted on 17 April 2017) ↩︎
TzuTa Lin, LabelImg, https://github.com/tzutalin/labelImg. (2015) ↩︎
L. Zhang, L. Lin, X. Liang, K. He, Is Faster R-CNN Doing Well for Pedestrian Detection?. (Submitted on 24 July 2016) ↩︎
C. Eggert, S. Brehm, A. Winschel, D. Zecha and R. Lienhart, A Closer Look: Small Object Detection in Faster R-CNN. 2017 IEEE International Conference on Multimedia and Expo (ICME), Hong Kong, 2017, pp. 421-426. ↩︎
S. Ren, K. He, R. Girshick, J. Sun, Faster R-CNN: Towards Real-Time Object Detection with Region Proposal Networks. (Submitted on 4 June 2015) -> GitHub [here] ↩︎
R. Girshick, Fast R-CNN. (Submitted on 30 April 2015) -> GitHub [here] ↩︎
R. Girshick, J. Donahue, T. Darrell, J. Malik, Rich feature hierarchies for accurate object detection and semantic segmentation. (Submitted on 11 November 2013) -> GitHub [here] ↩︎
K. He, X. Zhang, S. Ren, J. Sun, Deep Residual Learning for Image Recognition. Submitted on 10 December 2015) -> GitHub here] ↩︎
T. Lin, M. Maire, S. Belongie, L. Bourdev, R. Girshick, J. Hays, P. Perona, D. Ramanan, C. L. Zitnick, P. Dollár, Microsoft COCO: Common Objects in Context. (Submitted on 1 May 2014) -> Data link [here] ↩︎
J. Redmon, A. Farhadi, YOLOv3: An Incremental Improvement. (Submitted on 8 April 2018) ↩︎
J. Huang, V. Rathod, C. Sun, M. Zhu, A. Korattikara, A. Fathi, I. Fischer, Z. Wojna, Y. Song, S. Guadarrama, K. Murphy, Speed/accuracy trade-offs for modern convolutional object detectors. (Submitted on 30 November 2016) ↩︎